Last Updated on April 7, 2026 by Vivekanand
You’ve written C code for years. You type gcc main.c -o main, hit enter, and out pops an executable. But what actually happens between your source file and that binary? The C compilation process is a multi-stage pipeline, and each stage transforms your code into something fundamentally different.
In our Assembly Series, we learned to read assembly — syscalls, calling conventions, stack frames, executable formats, and dynamic linking. Now we’re flipping the perspective. Instead of reading what the compiler produced, we’re going to trace how it produces it. This is the first post in the Compiler Internals series, and we start at the very beginning: the C compilation process pipeline.
Table of Contents
The Big Picture: The C Compilation Process Pipeline
When you run gcc main.c -o main, you’re not invoking a single monolithic tool. You’re triggering a pipeline of four distinct stages, each consuming the output of the previous one:
Source Code (.c)
      │
      ▼
┌─────────────┐
│ Preprocessor │  →  Expanded Source (.i)
└─────────────┘
      │
      ▼
┌──────────┐
│ Compiler  │  →  Assembly (.s)
└──────────┘
      │
      ▼
┌───────────┐
│ Assembler  │  →  Object File (.o)
└───────────┘
      │
      ▼
┌────────┐
│ Linker  │  →  Executable (ELF / PE / Mach-O)
└────────┘
Each stage has a single responsibility, a distinct input format, and a distinct output format. The beauty of this design is that you can stop the pipeline at any stage and inspect the intermediate output — which is exactly what we’re going to do.
Let’s use a simple C program as our running example throughout this post:
// main.c
#include <stdio.h>

#define GREETING "Hello, Compiler!"

int add(int a, int b) {
    return a + b;
}

int main(void) {
    int result = add(3, 4);
    printf("%s Result: %d\n", GREETING, result);
    return 0;
}
Nothing fancy — but this tiny program will reveal the entire machinery that transforms human-readable text into machine instructions.
Stage 1: Preprocessing — Expanding the Macros
The first stage of the C compilation process is the preprocessor. It operates purely on text — no understanding of C syntax, no type checking, no semantic analysis. It handles:
#includedirectives — copy-pastes the contents of header files#definemacros — textual find-and-replace#ifdef/#ifndef— conditional compilation#pragma— compiler-specific instructions- Line splicing, trigraphs, and comment stripping
You can stop GCC or Clang after preprocessing with the -E flag:
# GCC
gcc -E main.c -o main.i

# Clang
clang -E main.c -o main.i
Open main.i and you’ll find something surprising: that tiny 14-line program has expanded to thousands of lines. On a typical Linux system with glibc, the preprocessed output can exceed 800 lines — all from a single #include <stdio.h>.
Here’s what the relevant portion of the preprocessed output looks like (the tail end of main.i):
// ... hundreds of lines from stdio.h, stddef.h, etc. ...

# 4 "main.c"

int add(int a, int b) {
    return a + b;
}

int main(void) {
    int result = add(3, 4);
    printf("%s Result: %d\n", "Hello, Compiler!", result);
    return 0;
}
Notice two important things. First, GREETING has been replaced with its literal string value "Hello, Compiler!" — pure textual substitution. Second, the #include <stdio.h> is gone, replaced by hundreds of lines of type definitions, function declarations, and macro expansions from the standard library headers.
The # 4 "main.c" line is a linemarker — it tells the compiler “the following code originally came from line 4 of main.c.” This is how the compiler maps errors back to your original source file, even though it’s working with the expanded output.
Why This Matters
Understanding preprocessing explains several common C pitfalls: why #include order matters (one header can redefine macros from another), why include guards exist (preventing duplicate definitions when a header is included multiple times), and why -DDEBUG on the command line works (it’s equivalent to #define DEBUG at the top of your file).
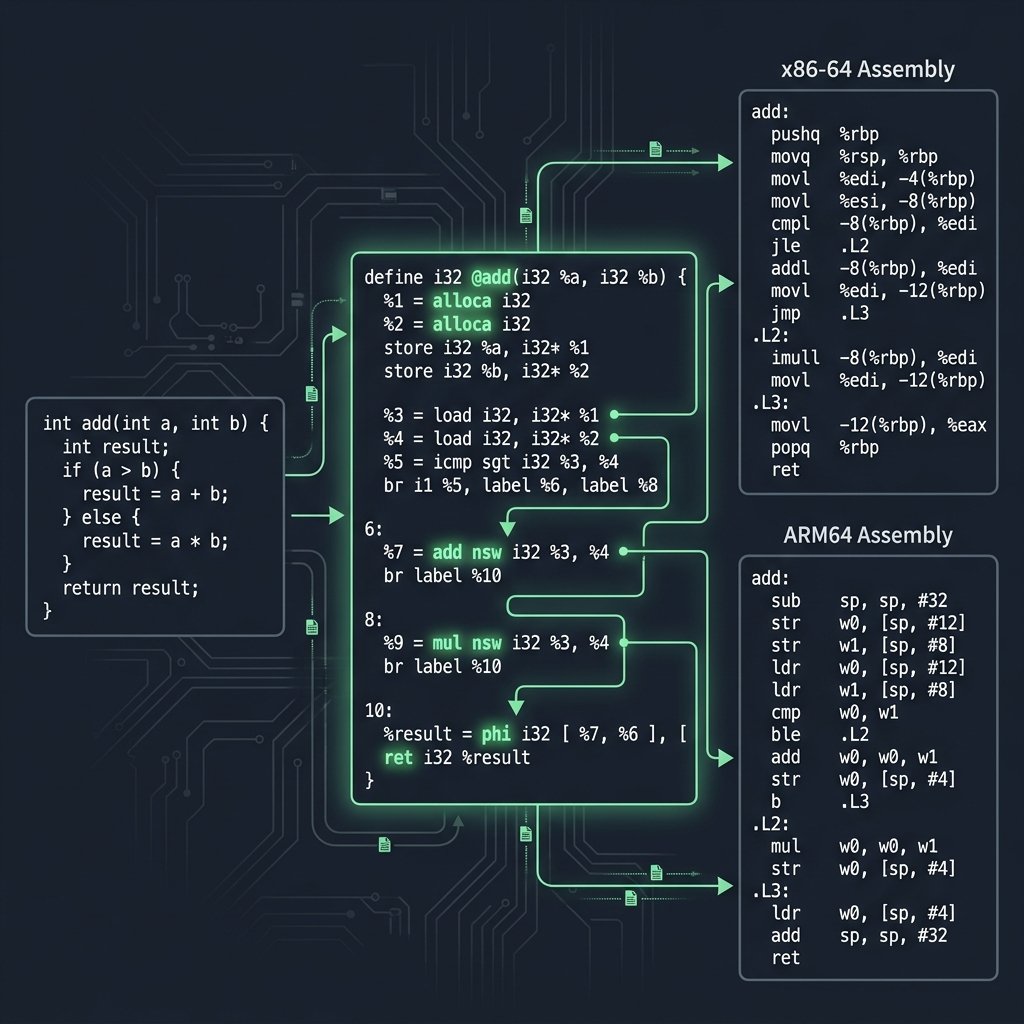
Stage 2: Compilation — From C to Assembly
This is where the real magic happens. The compiler proper takes the preprocessed C code and transforms it into assembly language. This stage is itself a complex pipeline of sub-stages:
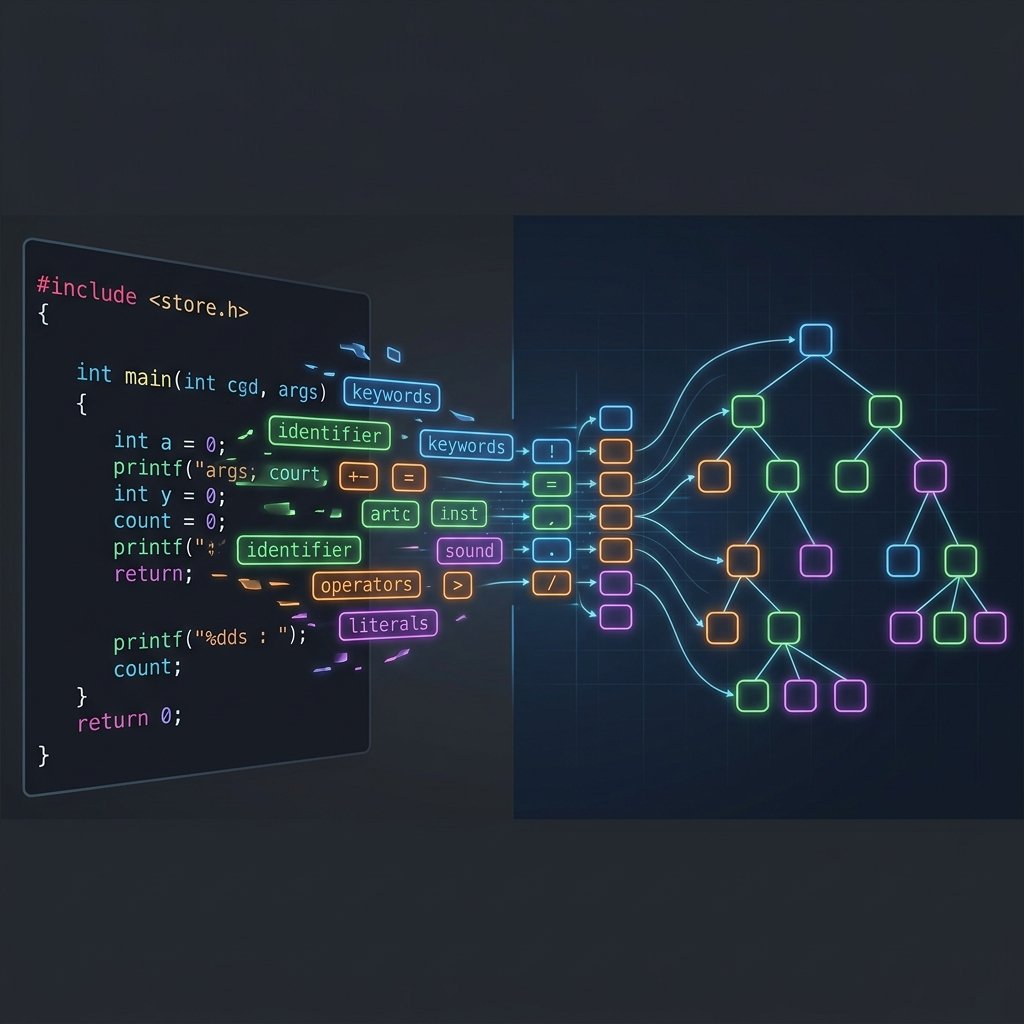
- Lexical Analysis (Lexing) — breaks source text into tokens (keywords, identifiers, operators, literals)
- Syntax Analysis (Parsing) — builds an Abstract Syntax Tree (AST) from the token stream
- Semantic Analysis — type checking, scope resolution, implicit conversions
- Intermediate Representation (IR) Generation — converts the AST to a lower-level, platform-independent form
- Optimization — transforms the IR to produce faster or smaller code
- Code Generation — emits target-specific assembly from the optimized IR
Each of these sub-stages will get its own deep-dive post later in this series. For now, let’s see the end result. Use -S to stop after compilation:
# GCC → x86-64 assembly
gcc -S -O1 main.c -o main_gcc.s

# Clang → x86-64 assembly
clang -S -O1 main.c -o main_clang.s
Here’s GCC’s x86-64 output for the add function at -O1:
add:
        lea     eax, [rdi+rsi]    ; eax = a + b
        ret
And here’s what the same function looks like targeting ARM64:
add:
        add     w0, w0, w1        // w0 = a + b
        ret
Same C code, completely different instruction sets — but identical semantics. If you followed our calling conventions post, you’ll recognize that both architectures receive the first two integer arguments in registers (edi/esi on x86-64 via the System V ABI, w0/w1 on ARM64 via AAPCS64) and return the result in eax or w0.
You can see this live on Godbolt Compiler Explorer — try switching between GCC, Clang, and MSVC to see how different compilers handle the same code. Notice how GCC uses lea (load effective address) for the addition, while Clang may choose add directly. Both are valid, and the performance difference is negligible — but the choice reveals the different instruction selection strategies inside each compiler.
The C Compilation Process: GCC vs Clang Internals
Under the hood, GCC and Clang use fundamentally different architectures, even though they consume the same C code and produce functionally identical output:
| Stage | GCC | Clang/LLVM |
|---|---|---|
| Frontend | Custom C parser | Custom C parser → LLVM IR |
| IR | GIMPLE → RTL (two IRs) | LLVM IR (single unified IR) |
| Optimizer | GIMPLE passes + RTL passes | LLVM middle-end passes |
| Backend | RTL → target assembly | LLVM IR → SelectionDAG → target assembly |
We’ll explore these internal representations in detail in Part 3: LLVM IR Deep Dive. For now, the key takeaway is that “compilation” is not one step — it’s a sophisticated sub-pipeline.
Stage 3: Assembly — From Text to Machine Code
The assembler (as on Linux, or the compiler’s integrated assembler) takes the human-readable assembly and converts it into an object file — binary machine code with metadata. Use -c to stop after assembly:
# Produce object file
gcc -c main.c -o main.o

# Examine the object file
file main.o
# main.o: ELF 64-bit LSB relocatable, x86-64, version 1 (SYSV), not stripped

# Disassemble the object file
objdump -d main.o
The object file is not yet an executable. It’s a relocatable file — it contains machine code, but the addresses aren’t finalized yet. Function calls to external symbols (like printf) are recorded as relocation entries that the linker will resolve later.
If you’ve read our Executable File Formats post, you’ll recognize the section layout: .text for code, .rodata for read-only data (our format string), .symtab for the symbol table, and .rela.text for relocation records.
# View sections in the object file
readelf -S main.o

# View the symbol table
readelf -s main.o
# ...
#  8: 0000000000000000    15 FUNC  GLOBAL DEFAULT   1 add
#  9: 000000000000000f    48 FUNC  GLOBAL DEFAULT   1 main
# 10: 0000000000000000     0 NOTYPE GLOBAL DEFAULT UND printf

# View relocations
readelf -r main.o
# Relocation section '.rela.text':
#   Offset          Type           Sym. Value    Sym. Name + Addend
#   000000000022  R_X86_64_PLT32  0000000000000000 printf - 4
Notice that printf shows up as UND (undefined) in the symbol table. The object file knows it needs printf, but has no idea where it lives. That’s the linker’s job.
Stage 4: Linking — Assembling the Final Executable
The linker (ld) takes one or more object files and libraries, resolves all symbol references, applies relocations, and produces the final executable. This is where printf gets connected to its implementation in the C standard library.
# Link the object file into an executable
gcc main.o -o main

# Verify it's a proper executable
file main
# main: ELF 64-bit LSB pie executable, x86-64, version 1 (SYSV),
#        dynamically linked, interpreter /lib64/ld-linux-x86-64.so.2,
#        for GNU/Linux 3.2.0, not stripped

# Run it
./main
# Hello, Compiler! Result: 7
The linker performs several critical operations:
- Symbol resolution — matches every undefined symbol (
printf,__libc_start_main) to a definition in another object file or library - Relocation — patches all addresses now that the final memory layout is known
- Section merging — combines
.textsections from all input object files into a single.textsegment - Entry point setup — sets up
_start(which callsmain) as the program entry point
If you’ve read our posts on process loading and dynamic linking & relocations, you already understand what happens after this stage — the OS loader maps the executable into memory, the dynamic linker resolves any shared library dependencies through the GOT/PLT, and finally your main function runs.
Hands-On: Watching Every Stage of the C Compilation Process
Here’s a complete session showing each pipeline stage. You can follow along on any Linux or macOS system with GCC or Clang installed:
# Step 0: Start with source code
cat main.c
wc -l main.c          # ~14 lines

# Step 1: Preprocessing
gcc -E main.c -o main.i
wc -l main.i          # ~800+ lines (stdio.h expands dramatically)

# Step 2: Compilation to assembly
gcc -S -O1 main.c -o main.s
wc -l main.s          # ~30-50 lines of x86-64 assembly

# Step 3: Assembly to object file
gcc -c main.c -o main.o
file main.o           # ELF 64-bit LSB relocatable
ls -la main.o         # ~1.5 KB

# Step 4: Linking to executable
gcc main.o -o main
file main             # ELF 64-bit LSB pie executable
ls -la main           # ~16 KB (includes startup code + dynamic linking info)

# Run the final binary
./main                # Hello, Compiler! Result: 7
The size progression tells a story: 14 lines → 800+ lines → 30-50 lines → 1.5 KB binary → 16 KB executable. The preprocessor explodes the code, the compiler compresses it into assembly, the assembler converts it to binary, and the linker bundles everything needed to run.
The C Compilation Process Across Compilers: GCC vs Clang vs MSVC
One of the best ways to understand the C compilation process is to compare compiler outputs. Let’s look at how three major compilers handle our main function at -O1//O1:
GCC 14.2 (x86-64, Linux)
main:
        sub     rsp, 8
        mov     edx, 7            ; result = 7 (constant folded!)
        lea     rsi, [rip+.LC1]   ; "Hello, Compiler! Result: %d\n"
        mov     edi, 1
        xor     eax, eax
        call    __printf_chk@PLT
        xor     eax, eax
        add     rsp, 8
        ret
Clang 18 (x86-64, Linux)
main:
        push    rax
        lea     rdi, [rip + .L.str]
        lea     rsi, [rip + .L.str.1]
        mov     edx, 7            ; result = 7 (also constant folded)
        xor     eax, eax
        call    printf@PLT
        xor     eax, eax
        pop     rax
        ret
MSVC 19.40 (x86-64, Windows)
main PROC
        sub     rsp, 40           ; Shadow space (Windows x64 ABI)
        mov     r8d, 7
        lea     rdx, OFFSET FLAT:$SG
        lea     rcx, OFFSET FLAT:$SG2
        call    printf
        xor     eax, eax
        add     rsp, 40
        ret     0
main ENDP
All three compilers performed constant folding — they evaluated add(3, 4) at compile time and replaced the function call with the literal value 7. The add function was inlined and eliminated entirely. But the calling conventions differ: GCC and Clang follow the System V AMD64 ABI (arguments in rdi, rsi, rdx), while MSVC uses the Windows x64 calling convention (arguments in rcx, rdx, r8) with mandatory shadow space.
You can explore this live on Godbolt and toggle between compilers, optimization levels, and target architectures.
Under the Hood: What the Compiler Really Does
Let’s pull back the curtain a bit further. The “compilation” stage (Stage 2) is where 90% of the complexity lives. Here’s a more detailed view of what happens inside:
Source Text
    │
    ▼
┌──────────────────┐
│  Lexer/Tokenizer │  →  Token Stream: [int] [add] [(] [int] [a] [,] ...
└──────────────────┘
    │
    ▼
┌──────────────────┐
│      Parser      │  →  Abstract Syntax Tree (AST)
└──────────────────┘
    │
    ▼
┌──────────────────┐
│ Semantic Analyzer│  →  Type-Checked, Annotated AST
└──────────────────┘
    │
    ▼
┌──────────────────┐
│   IR Generator   │  →  Intermediate Representation (LLVM IR / GIMPLE)
└──────────────────┘
    │
    ▼
┌──────────────────┐
│    Optimizer     │  →  Optimized IR (constant folding, inlining, etc.)
└──────────────────┘
    │
    ▼
┌──────────────────┐
│  Code Generator  │  →  Target Assembly (x86-64, ARM64, etc.)
└──────────────────┘
You can actually see some of these intermediate stages with Clang:
# View the token stream
clang -Xclang -dump-tokens main.c 2>&1 | head -20

# View the AST
clang -Xclang -ast-dump -fsyntax-only main.c

# View the LLVM IR (unoptimized)
clang -S -emit-llvm -O0 main.c -o main.ll

# View the LLVM IR (optimized)
clang -S -emit-llvm -O1 main.c -o main_opt.ll
Each of these outputs deserves its own deep-dive, and that’s exactly what this series will deliver. Part 2 covers lexing and parsing, Part 3 explores LLVM IR, and Part 4 dives into optimization passes.
Why Understanding the C Compilation Process Matters
You might be thinking: “I’ve compiled C programs for years without knowing any of this. Why should I care?” Here’s why:
- Debugging — When you get a “undefined reference to” error, you now know it’s a linker error, not a compiler error. When you get “expected ‘;’ before ‘}'” it’s a parser error. Knowing which stage fails helps you fix problems faster.
- Performance — Understanding that
-O2enables specific optimization passes (constant folding, loop unrolling, auto-vectorization) helps you write code that the compiler can optimize effectively. - Cross-platform development — Knowing that the compiler backend is what changes between x86-64 and ARM64 (while the frontend stays the same) helps you reason about portability.
- Security — Exploit developers and security researchers need to understand how C maps to assembly to analyze vulnerable binaries.
- Career growth — Systems programming roles at companies like Google, Apple, Microsoft, and embedded firmware shops all expect this knowledge.
What’s Next
We’ve traced the complete C compilation process from source to executable. You now know the four pipeline stages, what each one produces, and how to inspect every intermediate output. In the next post, we’ll zoom into Stage 2 and explore the very first thing the compiler does when it sees your code: lexical analysis and parsing. We’ll break down tokens, context-free grammars, and the AST — the data structure that makes everything else possible.
Next up: Part 2 — Lexing & Parsing: How Compilers Read Your Code
Further Reading
- GCC Documentation: Overall Options — Official reference for
-E,-S,-c, and other compilation control flags - Assembly Hello World: A Cross-Platform Syscall Deep Dive — Where this series began — the assembly that compilers generate
- Executable File Formats: ELF, PE, and Mach-O Explained — Deep dive into the object file and executable formats produced by the assembler and linker
- Dynamic Linking & Relocations: How the GOT and PLT Work — What happens after linking for dynamically linked executables