Last Updated on February 22, 2026 by Vivekanand
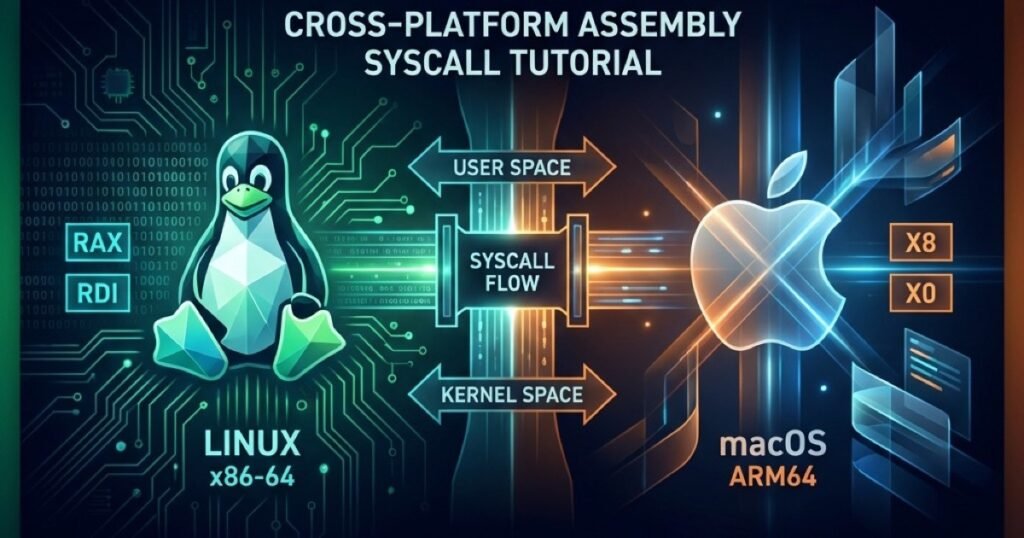
Understanding the bridge between your code and the kernel is the final key to demystifying how software works. Up to this point in our Assembly Series, you’ve mastered how to load a process, how calling conventions manage functions, how memory is laid out, and finally, how to talk directly to the hardware via system calls.
So, what do we do with all this low-level power? We build something real.
Table of Contents
In this final part of the series, we will combine all these concepts to build a debugger from scratch. And because we don’t believe in magic or hiding behind C wrappers, we are going to explore how to build its core engine entirely in pure Assembly across all three major operating systems: Linux, macOS, and Windows.
The Anatomy of a Debugger
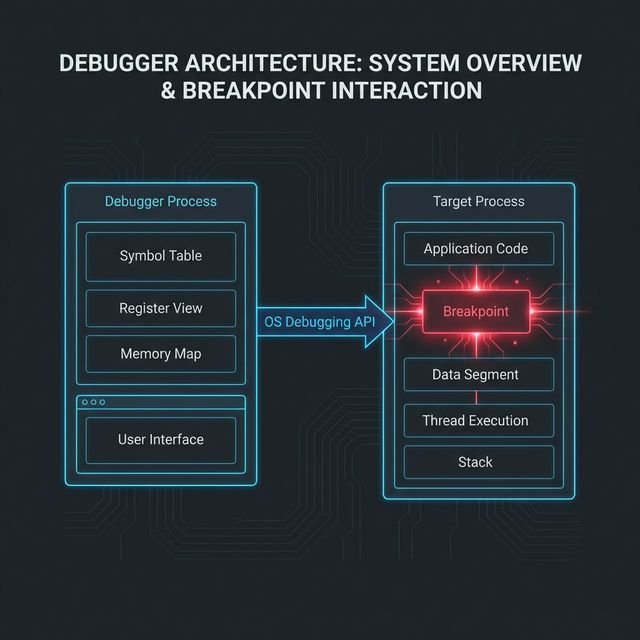
Whenever you type run in GDB, LLDB, or WinDbg, you are invoking a very specific set of OS-provided debugging APIs. All debuggers share the same fundamental architecture—a core loop that manages the execution of another process.
This loop consists of four main phases:
- Attach/Spawn: The debugger launches the target program as a child process and tells the operating system, “Hey, I’m watching this one.”
- Event Loop: The debugger pauses and waits for an event (like a signal, a crash, or a breakpoint) from the target.
- Inspect & Modify: While the target is suspended, the debugger peeks into its registers (like
RIPorRAX) or reads/writes its memory. This is how you set breakpoints! - Resume: The debugger tells the OS to resume the target’s execution until the next event.
A Word on Security Models & macOS SIP
Operating systems do not take kindly to processes spying on one another. On Linux, capabilities like CAP_SYS_PTRACE prevent arbitrary profiling. On Windows, you often need SeDebugPrivilege to attach to protected processes.
macOS takes this a step further with System Integrity Protection (SIP), which severely restricts reading another process’s memory. Does this mean we have to disable SIP to build our debugger?
No. To legally debug a process on macOS without disabling SIP, our debugger simply needs the right entitlement. By injecting an entitlements.plist file containing the com.apple.security.get-task-allow key during code signing, the macOS kernel will grant our debugger permission to debug its own child processes!
<?xml version="1.0" encoding="UTF-8"?>
<!DOCTYPE plist PUBLIC "-//Apple//DTD PLIST 1.0//EN" "http://www.apple.com/DTDs/PropertyList-1.0.dtd">
<plist version="1.0">
<dict>
    <key>com.apple.security.get-task-allow</key>
    <true/>
</dict>
</plist>
1. Linux: The Power of ptrace to build a debugger from scratch
On Linux, exactly one system call reigns supreme for debugging: ptrace (Process Trace). It is the engine behind GDB and strace.
Let’s look at how we build the debugger loop in pure x86-64 Linux assembly.
We use fork (Syscall 57) to split our process. The child process calls ptrace with the PTRACE_TRACEME command (0) before invoking execve (Syscall 59) to launch the target. The parent process uses wait4 (Syscall 61) to catch the child whenever it pauses.
    ; --- IN THE CHILD PROCESS ---
    ; ptrace(PTRACE_TRACEME, 0, 0, 0)
    mov rax, 101 ; sys_ptrace
    mov rdi, 0   ; PTRACE_TRACEME
    xor rsi, rsi
    xor rdx, rdx
    xor r10, r10
    syscall

    ; Setup args and execute the target program...
    mov rax, 59 ; sys_execve
    ; ... (arguments setup) ...
    syscall

    ; --- IN THE PARENT PROCESS (DEBUGGER) ---
wait_loop:
    ; wait4(child_pid, &status, 0, NULL)
    mov rax, 61
    mov rdi, r12 ; r12 holds the child pid
    lea rsi, [rel status]
    xor rdx, rdx
    xor r10, r10
    syscall

    ; Check if target exited
    mov eax, dword [rel status]
    and eax, 0x7f
    cmp eax, 0
    jz target_exited

    ; Target stopped. Here, you could peek at registers!
    ; Resume target: ptrace(PTRACE_CONT, pid, 0, 0)
    mov rax, 101
    mov rdi, 7   ; PTRACE_CONT
    mov rsi, r12
    xor rdx, rdx
    xor r10, r10
    syscall

    jmp wait_loop
By calling ptrace with PTRACE_GETREGS (12), the parent can suck the exact state of the child’s CPU registers into a structure (user_regs_struct).
- On x86-64: We inspect the Instruction Pointer (
RIP) and modify memory to inject anint 3(opcode0xCC) breakpoint. - On ARM64: We inspect the Program Counter (
PC) and, instead of0xCC, we write aBRKinstruction (like0xD4200000).
2. macOS: ptrace and Mach Ports to build a debugger from scratch
macOS is a BSD-derived system wrapped around the Mach microkernel. While macOS does have a ptrace system call (Syscall 0x200001A), Apple deliberately crippled it. It only supports basic attachment (PT_TRACE_ME, PT_CONTINUE, PT_KILL).
To build our macOS loop in assembly (whether x86-64 or ARM64 Apple Silicon), we use fork (Syscall 0x2000002) and wait4 (Syscall 0x2000007). We must understand how to build a debugger from scratch even on locked-down systems.
    ; --- IN THE CHILD PROCESS (x86-64) ---
    ; ptrace(PT_TRACE_ME, 0, 0, 0)
    mov rax, 0x200001A ; sys_ptrace
    mov rdi, 0         ; PT_TRACE_ME
    xor rsi, rsi
    xor rdx, rdx
    xor r10, r10
    syscall

    ; --- IN THE CHILD PROCESS (ARM64) ---
    ; ptrace(PT_TRACE_ME, 0, 0, 0)
    mov x16, 26         ; sys_ptrace (no 0x2000000 class offset)
    mov x0, 0           ; PT_TRACE_ME
    mov x1, 0
    mov x2, 0
    mov x3, 0
    svc 0x80
But what if you want to read registers on macOS? The ptrace call will fail. You must ask the Mach kernel directly using Mach RPC functions like thread_get_state. Because constructing raw Mach messages in Assembly requires packing colossal RPC structs manually, most macOS debuggers (like LLDB) rely heavily on the C layer for the Mach APIs.
3. Windows: The Debug API Loop to build a debugger from scratch
Windows handles debugging completely differently. Instead of relying on signals like Linux or macOS, the Windows kernel exposes a dedicated, event-driven Debug API.
Instead of fork and ptrace, we use CreateProcessA directly, passing the DEBUG_ONLY_THIS_PROCESS creation flag. The OS will automatically attach your process as the debugger.
We then enter a continuous WaitForDebugEvent loop. Because the Windows API uses the __fastcall convention on x64, our assembly reflects setup using RCX, RDX, R8, and R9.
    ; CreateProcessA setup (shadow space and parameters)
    ; lpCreationFlags = DEBUG_ONLY_THIS_PROCESS (value: 2)
    mov qword [rsp+40], 2
    call CreateProcessA

debug_loop:
    ; WaitForDebugEvent(&debug_event, INFINITE)
    lea rcx, [rel de] ; de = DEBUG_EVENT struct
    mov rdx, 0xFFFFFFFF ; INFINITE timeout
    call WaitForDebugEvent

    test eax, eax
    jz exit_debugger

    ; Check if process exited (EXIT_PROCESS_DEBUG_EVENT = 5)
    mov eax, dword [rel de]
    cmp eax, 5
    je exit_debugger

    ; Resume the target: ContinueDebugEvent(pid, tid, DBG_CONTINUE)
    mov ecx, dword [rel de + 4] ; dwProcessId
    mov edx, dword [rel de + 8] ; dwThreadId
    mov r8, 0x00010002          ; DBG_CONTINUE
    call ContinueDebugEvent

    jmp debug_loop
The DEBUG_EVENT structure populates with exact details whenever an exception occurs (like hitting a breakpoint), a DLL is loaded, or a thread starts. To read registers, you pause the loop and call GetThreadContext() (specifying CONTEXT_AMD64 or CONTEXT_ARM64 depending on the architecture).
Concluding the Assembly Series
If you have followed along, you now know how to build a debugger from scratch. From simple instruction definitions to manipulating the kernel for debugging, we have traversed the full stack of how a computer truly executes code. You now know exactly what happens behind the scenes of your compiler, linker, and debugger.
While Assembly isn’t something most developers write by hand every day, understanding how it works equips you to diagnose issues, write hyper-optimized C/Rust code, and reverse engineer black-box software.
Welcome to the low level. Stay curious.