Last Updated on April 1, 2026 by Vivekanand
Before a compiler can optimize your code or generate assembly, it has to understand your text — and it doesn’t read code the way you do. A compiler lexer and parser work together to transform a flat stream of characters into a structured tree that captures your program’s meaning. This is the first and most fundamental step in compilation, and it’s where every syntax error you’ve ever seen originates.
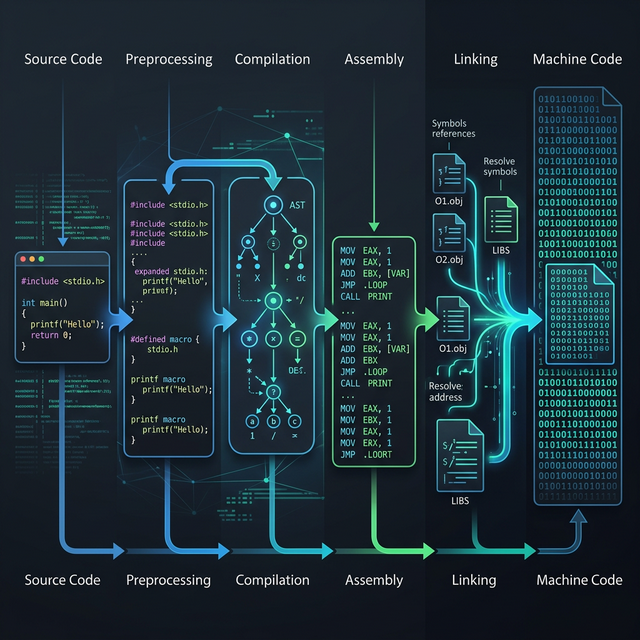
In Part 1 of this series, we traced the complete C compilation pipeline — preprocessing, compilation, assembly, and linking. We saw that the “compilation” stage is itself a complex sub-pipeline of six steps. Now we’re zooming into the first two: lexical analysis (lexing) and syntax analysis (parsing). By the end of this post, you’ll understand exactly what a compiler lexer parser does, you’ll see real Clang output for each stage, and you’ll know how to inspect these intermediate representations yourself.
Table of Contents
What the Compiler Lexer Parser Actually Does
Here is the high-level view of how the compiler lexer parser architecture handles the frontend responsibilities of understanding your source code:
Source Text (characters)
    │
    ▼
┌──────────────────┐
│  Lexer/Tokenizer │  →  Token Stream: [int] [add] [(] [int] [a] ...
└──────────────────┘
    │
    ▼
┌──────────────────┐
│      Parser      │  →  Abstract Syntax Tree (AST)
└──────────────────┘
    │
    ▼
┌──────────────────┐
│ Semantic Analyzer│  →  Type-Checked, Annotated AST
└──────────────────┘
    │
    ▼
    ... (IR Generation → Optimization → Code Generation)
Each stage feeds the next. The lexer breaks characters into tokens. The parser arranges tokens into a tree. The semantic analyzer checks that the tree makes sense. Let’s dive into each one.
Lexical Analysis: Breaking Code into Tokens
The lexer (also called a tokenizer or scanner) is the compiler’s first pass over your source code. It reads the raw character stream and groups characters into tokens — the atomic, meaningful units of the language. Think of it as the compiler learning to read individual words before trying to understand sentences.
Token Categories
Every token belongs to a category. Here are the main ones in C:
| Category | Examples | What It Represents |
|---|---|---|
| Keyword | int, return, if, while | Reserved words with special meaning |
| Identifier | add, main, result, x | Names you define (functions, variables) |
| Literal | 42, 3.14, "hello" | Constant values embedded in code |
| Operator | +, -, *, =, == | Arithmetic, assignment, comparison |
| Punctuation | {, }, (, ), ; | Structural delimiters |
How the Compiler Lexer Parser Works Under the Hood
The lexer scans your source code character by character, using rules (often modeled as finite automata or regular expressions) to decide where each token starts and ends. When it encounters the character i, it doesn’t immediately emit a token — it keeps reading. If the next characters are n and t followed by whitespace, it recognizes the keyword int. If instead the next character is f followed by (, it recognizes the keyword if. If the characters spell index, it’s an identifier, not a keyword.
Crucially, the lexer discards whitespace, comments, and line continuations. By the time the parser sees the token stream, all formatting is gone. That’s why int a=3+4; and int a = 3 + 4 ; produce identical token streams — and identical compiled output.
Hands-On: Clang’s Token Dump
You don’t have to imagine what tokens look like. Clang lets you see the actual token stream with -dump-tokens. Let’s use the same add function from Part 1:
// add.c
int add(int a, int b) {
    return a + b;
}# Dump the token stream (output goes to stderr, so redirect)
clang -Xclang -dump-tokens add.c 2>&1Here’s what Clang produces:
int 'int'        [StartOfLine]  Loc=<add.c:2:1>
identifier 'add'  [LeadingSpace] Loc=<add.c:2:5>
l_paren '('                      Loc=<add.c:2:8>
int 'int'                        Loc=<add.c:2:9>
identifier 'a'   [LeadingSpace]  Loc=<add.c:2:13>
comma ','                        Loc=<add.c:2:14>
int 'int'        [LeadingSpace]  Loc=<add.c:2:16>
identifier 'b'   [LeadingSpace]  Loc=<add.c:2:20>
r_paren ')'                      Loc=<add.c:2:21>
l_brace '{'      [LeadingSpace]  Loc=<add.c:2:23>
return 'return'  [StartOfLine] [LeadingSpace] Loc=<add.c:3:5>
identifier 'a'   [LeadingSpace]  Loc=<add.c:3:12>
plus '+'         [LeadingSpace]  Loc=<add.c:3:14>
identifier 'b'   [LeadingSpace]  Loc=<add.c:3:16>
semi ';'                         Loc=<add.c:3:17>
r_brace '}'      [StartOfLine]   Loc=<add.c:4:1>
eof ''           [StartOfLine]   Loc=<add.c:4:2>
Every token has three pieces of information: its type (int, identifier, l_paren, plus), its literal text (the characters it corresponds to), and its source location (Loc=<add.c:2:5> means file add.c, line 2, column 5). Notice the comment on line 1 is completely gone — the lexer stripped it before producing any tokens.
Also notice the annotations: [StartOfLine] and [LeadingSpace]. These are whitespace hints that the preprocessor uses, but the parser ignores them entirely. By the time parsing begins, the token stream is purely semantic — no formatting survives.
Syntax Analysis: How the Compiler Lexer Parser Builds a Tree
Once the lexer hands over the token stream, the parser takes over. Its job is to answer the question: “Does this sequence of tokens follow the grammatical rules of C?” If yes, it builds an Abstract Syntax Tree (AST). If not, it throws a syntax error.
Context-Free Grammars and BNF
The rules that define valid C syntax are expressed as a context-free grammar (CFG). You may have seen this notation called BNF (Backus-Naur Form). Here’s a simplified grammar for arithmetic expressions:
expression   → term (('+' | '-') term)*
term         → factor (('*' | '/') factor)*
factor       → NUMBER | IDENTIFIER | '(' expression ')'
This grammar encodes operator precedence. Because term handles * and / before expression handles + and -, the parser knows that a + b * c means a + (b * c), not (a + b) * c. Precedence isn’t a special rule bolted on — it’s baked directly into the grammar’s structure.
Recursive Descent: The Parser’s Strategy
Both GCC and Clang use recursive descent parsers — and they’re hand-written, not generated by tools like yacc or bison. In a recursive descent parser, each grammar rule becomes a function. The expression rule becomes a parseExpression() function that calls parseTerm(), which calls parseFactor(). The call stack mirrors the grammar hierarchy.
Why hand-written instead of generated? Two reasons. First, better error messages — when the parser writes its own error recovery, it can produce diagnostics like Clang’s famously helpful “did you mean…?” suggestions. Second, performance — hand-tuned parsers avoid the overhead of table-driven state machines.
One of the most common ways you interact with the compiler lexer parser is when you encounter syntax errors. When you see error: expected ';' before '}', that’s the parser talking. It was expecting a semi token (because the grammar says statements end with semicolons), but instead it encountered an r_brace token. The parser doesn’t know why you forgot the semicolon — it just knows the token sequence doesn’t match any valid grammar rule.
This is also why some error messages seem misleading. The parser reports what went wrong from its perspective, which doesn’t always match your intent. A missing closing parenthesis might produce an error several lines later, because the parser keeps trying to match grammar rules with the wrong nesting.
The Abstract Syntax Tree (AST): The Compiler’s Understanding
The parser’s output is the Abstract Syntax Tree — a hierarchical representation of your program’s structure. It’s “abstract” because it strips away syntactic noise like semicolons, braces, and parentheses, keeping only the logical operations and their relationships.
Here’s what the AST looks like for our add function:
FunctionDecl 'add' → returns 'int'
├── ParmVarDecl 'a' → type 'int'
├── ParmVarDecl 'b' → type 'int'
└── CompoundStmt
    └── ReturnStmt
        └── BinaryOperator '+'
            ├── DeclRefExpr 'a' → type 'int'
            └── DeclRefExpr 'b' → type 'int'
This tree captures everything the compiler needs to know: the function takes two int parameters and returns their sum. The semicolons, braces, and parentheses from the source code are gone — they served their purpose during parsing and are no longer needed.
Hands-On: Clang’s AST Dump
Clang can show you the actual AST it builds. This is one of the most powerful diagnostic tools available:
# Dump the AST (with -fsyntax-only to skip code generation)
clang -Xclang -ast-dump -fsyntax-only add.c
Here’s the output for our add function (trimmed to show just the relevant part):
FunctionDecl 0x55a1b50 <add.c:2:1, line:4:1> line:2:5 add 'int (int, int)'
├─ParmVarDecl 0x55a1a10 <col:9, col:13> col:13 used a 'int'
├─ParmVarDecl 0x55a1a88 <col:16, col:20> col:20 used b 'int'
└─CompoundStmt 0x55a1c40 <col:23, line:4:1>
  └─ReturnStmt 0x55a1c28 <line:3:5, col:16>
    └─BinaryOperator 0x55a1c08 <col:12, col:16> 'int' '+'
      ├─ImplicitCastExpr 0x55a1bd8 <col:12> 'int' <LValueToRValue>
      │ └─DeclRefExpr 0x55a1b98 <col:12> 'int' lvalue ParmVar 0x55a1a10 'a' 'int'
      └─ImplicitCastExpr 0x55a1bf0 <col:16> 'int' <LValueToRValue>
        └─DeclRefExpr 0x55a1bb8 <col:16> 'int' lvalue ParmVar 0x55a1a88 'b' 'int'
Let’s unpack this. Each line is an AST node with several pieces of information:
- Node type —
FunctionDecl,BinaryOperator,DeclRefExpr, etc. - Memory address —
0x55a1b50— the node’s location in the compiler’s memory (useful for debugging Clang itself) - Source location —
<add.c:2:1, line:4:1>— where this construct appears - Type information —
'int'— the resolved type of this expression - Additional metadata —
lvalue,used,<LValueToRValue>— semantic annotations
Notice the ImplicitCastExpr nodes with <LValueToRValue>. You didn’t write any casts in your source code — the compiler inserted them. When you write a + b, a and b are lvalues (they refer to memory locations), but the + operator needs rvalues (actual values). The compiler silently inserts these conversions. This is the semantic analyzer at work — and it’s happening inside the same AST.
From AST to Assembly: Tracing the Path
Every AST node eventually maps to machine instructions. Let’s trace the path for our add function:
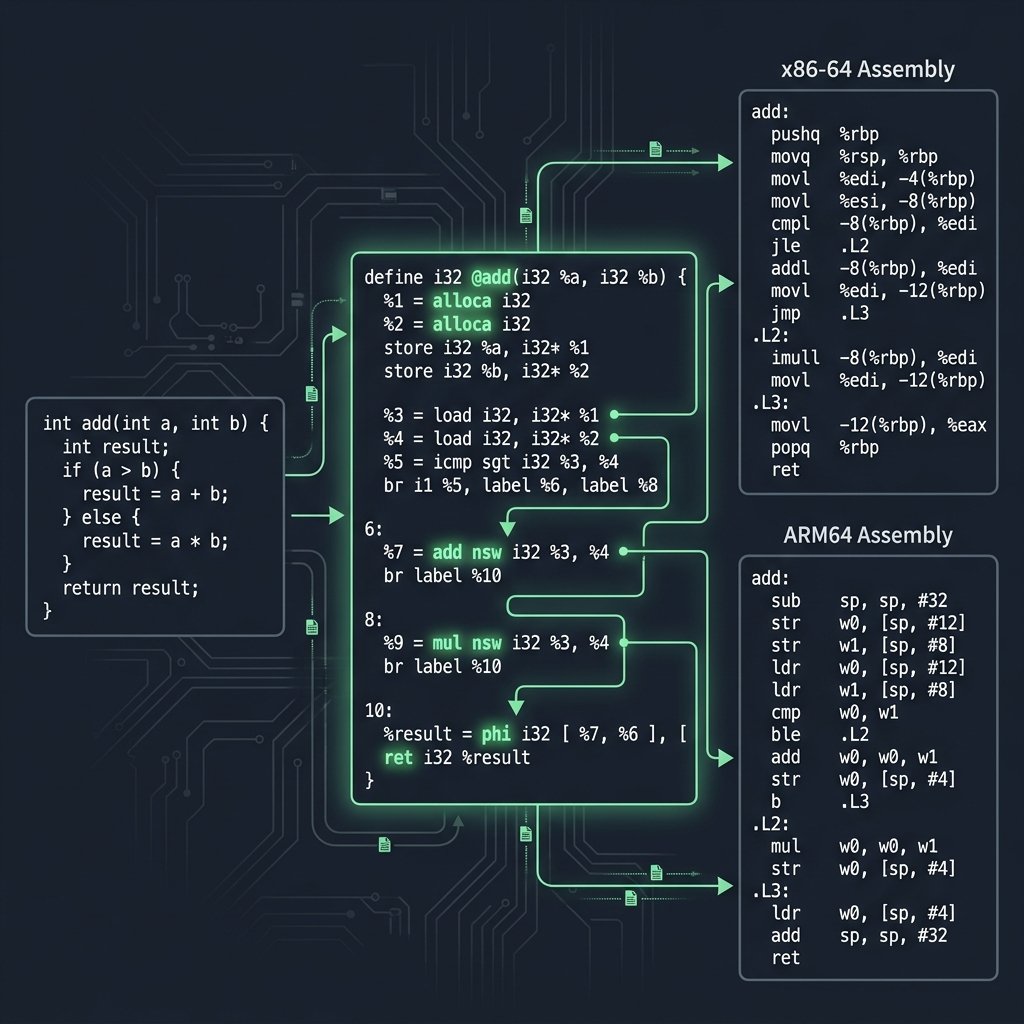
| AST Node | What It Means | x86-64 Assembly | ARM64 Assembly |
|---|---|---|---|
ParmVarDecl 'a' | First parameter | edi (System V ABI) | w0 (AAPCS64) |
ParmVarDecl 'b' | Second parameter | esi (System V ABI) | w1 (AAPCS64) |
BinaryOperator '+' | Addition | lea eax, [rdi+rsi] | add w0, w0, w1 |
ReturnStmt | Return value | ret (result in eax) | ret (result in w0) |
This is the same assembly output we saw in Part 1. The difference is that now you can see exactly where each instruction came from in the compiler’s internal representation. The AST’s BinaryOperator '+' directly drives the code generator to emit an addition instruction — though the specific instruction (lea vs add) is a code generation decision we’ll explore in Part 5. You can see this live on Godbolt Compiler Explorer.
Semantic Analysis: The Compiler’s Type Checker
After parsing builds the AST, the semantic analyzer walks the tree and checks that everything makes logical sense. This is where the compiler catches errors that are syntactically valid but semantically wrong.
Type Checking and Implicit Conversions
Consider this code:
double x = 3;          // int → double conversion
int y = 3.14;          // double → int (warning: truncation)
int *p = 42;           // error: incompatible types
The first line is legal — the compiler silently inserts an IntegralToFloating cast. The second line triggers a warning because it truncates. The third line is a hard error — you can’t assign an integer to a pointer without an explicit cast. All three decisions happen during semantic analysis, and they show up as ImplicitCastExpr nodes in the AST.
You already saw this in action with the <LValueToRValue> casts in our add function. The semantic analyzer enriches the AST with type information that the parser alone couldn’t determine.
Scope Resolution
The semantic analyzer also handles scope resolution — figuring out which declaration each identifier refers to. When you write x inside a function, the compiler searches for x in the local scope first, then the enclosing scope, then the file scope. If it’s not found anywhere, you get error: use of undeclared identifier 'x'.
In the AST dump, you can see scope resolution at work: each DeclRefExpr contains a pointer back to its declaration (ParmVar 0x55a1a10 'a'). The parser created the reference; the semantic analyzer resolved it to a specific declaration.
A More Complex Example: The Compiler Lexer Parser in Action
Let’s see how the compiler lexer parser handles a slightly more complex function with control flow:
// max.c
int max(int a, int b) {
    if (a > b)
        return a;
    return b;
}
Running clang -Xclang -ast-dump -fsyntax-only max.c produces:
FunctionDecl 0x... <max.c:2:1, line:6:1> line:2:5 max 'int (int, int)'
├─ParmVarDecl 0x... col:13 used a 'int'
├─ParmVarDecl 0x... col:20 used b 'int'
└─CompoundStmt 0x...
  ├─IfStmt 0x...
  │ ├─BinaryOperator 0x... 'int' '>'
  │ │ ├─ImplicitCastExpr 0x... 'int' <LValueToRValue>
  │ │ │ └─DeclRefExpr 0x... 'int' lvalue ParmVar 0x... 'a' 'int'
  │ │ └─ImplicitCastExpr 0x... 'int' <LValueToRValue>
  │ │   └─DeclRefExpr 0x... 'int' lvalue ParmVar 0x... 'b' 'int'
  │ └─ReturnStmt 0x...
  │   └─ImplicitCastExpr 0x... 'int' <LValueToRValue>
  │     └─DeclRefExpr 0x... 'int' lvalue ParmVar 0x... 'a' 'int'
  └─ReturnStmt 0x...
    └─ImplicitCastExpr 0x... 'int' <LValueToRValue>
      └─DeclRefExpr 0x... 'int' lvalue ParmVar 0x... 'b' 'int'
The AST clearly shows the program’s control flow: the IfStmt node has two children — the condition (BinaryOperator '>') and the “then” branch (ReturnStmt returning a). The second ReturnStmt returning b is a sibling of the IfStmt, not nested within it. This structure is exactly what the code generator needs to produce conditional branch instructions.
GCC vs Clang: Frontend Differences
Both GCC and Clang parse C using hand-written recursive descent parsers, but their internal architectures diverge after that point:
| Aspect | GCC | Clang |
|---|---|---|
| Parser type | Hand-written recursive descent | Hand-written recursive descent |
| AST representation | GENERIC tree (converted to GIMPLE) | Clang AST (rich, queryable) |
| Error messages | Good, improving over time | Excellent, with “did you mean…?” and fix-its |
| AST inspection tools | -fdump-tree-original | -ast-dump, -ast-print, AST matchers |
| Post-parse target | GENERIC → GIMPLE → RTL | Clang AST → LLVM IR |
One of the biggest practical differences is error diagnostics. Clang was explicitly designed from the start to produce high-quality diagnostics. If you write pritnf instead of printf, Clang will suggest the correction. GCC has been catching up in recent versions, but Clang’s error messages remain a gold standard in compiler design.
Hands-On: The Complete Compiler Lexer Parser Pipeline
Here’s a complete hands-on session you can follow on any system with Clang installed. We’ll watch the same code go through every frontend stage:
# Create our test file
cat > add.c <<'EOF'
int add(int a, int b) {
    return a + b;
}
EOF
# Stage 1: Lexical Analysis — see the token stream
echo "=== TOKENS ==="
clang -Xclang -dump-tokens add.c 2>&1
# Stage 2: Parsing + Semantic Analysis — see the AST
echo "=== AST ==="
clang -Xclang -ast-dump -fsyntax-only add.c
# Stage 3: Preview — see the LLVM IR this AST produces (Part 3 deep-dive)
echo "=== LLVM IR ==="
clang -S -emit-llvm -O0 add.c -o - 2>/dev/null
# Stage 4: Preview — see the final assembly (covered in Part 1)
echo "=== ASSEMBLY (x86-64) ==="
clang -S -O1 add.c -o -
Running this gives you the complete view: characters → tokens → AST → LLVM IR → assembly. Each stage’s output is a transformation of the previous one. The compiler lexer parser (stages 1 and 2) builds the foundation that everything else depends on.
Why Understanding the Compiler Lexer Parser Matters
Knowing how the compiler frontend works gives you practical superpowers:
- Better debugging — You can distinguish lexer errors (unterminated string literal), parser errors (missing semicolon), and semantic errors (type mismatch). Each comes from a different stage and requires a different fix.
- Compiler tool development — Static analyzers, linters, formatters, and IDEs all work with token streams and ASTs. Understanding these structures is the foundation of tooling like
clang-tidy,clang-format, and language servers. - Reading compiler source code — If you ever dive into the Clang or GCC codebase, the functions map directly to the grammar rules we discussed.
ParseExpression,ParseStatement,ActOnBinaryOp— the code structure mirrors the theory. - Writing your own languages — Even a domain-specific language or configuration parser uses the same lexer → parser → AST pattern. The concepts scale from tiny DSLs to full programming languages.
What’s Next
We’ve seen how the compiler’s frontend transforms flat text into a rich, structured AST — the compiler’s complete understanding of your program. But the AST is still high-level. In the next post, we’ll watch the compiler lower this tree into LLVM IR — a platform-independent intermediate representation that sits between your C code and the target assembly. If the AST is the compiler’s understanding of what you wrote, LLVM IR is its plan for how to execute it.
Next up: Part 3 — LLVM IR: The Universal Compiler Language
Further Reading
- Introduction to the Clang AST — Official LLVM documentation on Clang’s AST structure, node types, and how to navigate the tree
- How a C Program Becomes Machine Code — Part 1 of this series, covering the full compilation pipeline that the compiler lexer parser feeds into
- Calling Conventions Demystified — How the AST’s parameter declarations map to register assignments via the System V and AAPCS64 ABIs